
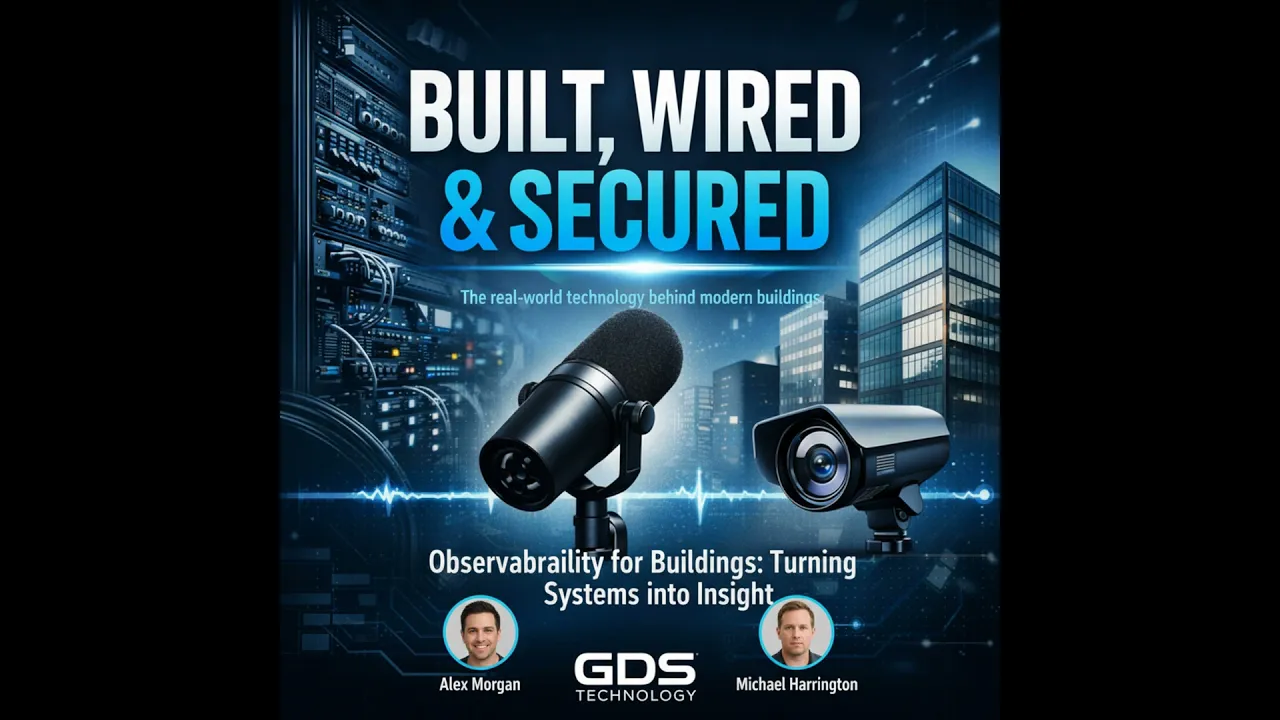
Show Notes
Observability Starts Before the Outage
Modern buildings generate a steady flow of signals: equipment alarms, sensor readings, badge activity, vendor notifications, error messages, and performance data. The challenge is not simply collecting more of it. The challenge is turning those isolated signals into insight that helps property teams prevent tenant-impacting problems before they become outages.
This episode looks at building observability as an operational discipline. Instead of treating each alarm or vendor portal as a separate source of truth, teams can view the building as a connected system. That shift makes it easier to spot gradual performance decline, reduce false alarms, improve incident response, and make better maintenance and capital-planning decisions.
Metrics, Logs, and Traces in a Building Environment
The conversation translates three common observability concepts into practical building operations:
- Metrics: Numbers tracked over time, such as chilled-water flow, elevator door cycles, badge swipe rates, power draw, availability, and response time.
- Logs: Discrete events such as equipment alarms, vendor alerts, and error messages.
- Traces: Sequences that show how one issue can ripple through connected systems, such as a power problem affecting other building services.
These signals matter because they support uptime, tenant experience, and operational cost control. Observability is not only about catching dramatic failures. It is also about identifying the subtle drift that can quietly reduce system capacity until weather, occupancy, or another condition turns a manageable issue into a visible disruption.
Why Signal Chaos Hides Real Problems
One of the biggest obstacles is signal chaos. Building teams often work across many vendor dashboards, each with different telemetry, thresholds, alert rules, and interfaces. Individual vendors may provide useful information, but when signals remain proprietary, inconsistent, and isolated, no one can easily correlate what is happening across the environment.
The episode describes a familiar outcome: teams receive so many alerts that they stop trusting them. Alerts initially feel urgent, but repeated false alarms and low-value notifications erode confidence. Eventually, staff begin to ignore notices that may contain the early evidence of a real failure.
Technical issues can further obscure the situation. Intermittent telemetry, packet loss, clock drift, and poorly configured thresholds can trigger alarms at the wrong times or conceal meaningful trends. The result is a combined technical and organizational issue: data may exist, but the operational process does not reliably turn it into action.
The Risk of Slow Degradation
A key example involves a chilled-water loop with flow rates that declined gradually over several months because a variable-speed drive slowly lost calibration. The chillers appeared healthy. Pumps appeared to be running. No individual vendor alarm seemed critical. But because no one monitored flow as a trend over time, the declining performance remained invisible.
When outdoor temperatures rose, the system no longer had enough capacity. Multiple floors lost cooling. This is the central lesson of the episode: a single alarm may not reveal a slow failure mode, but a simple metric and an alert for sustained decline can make that trend visible early enough to act.
Where to Begin With Limited Budget and Staff
Property teams do not need to instrument every device to gain meaningful visibility. The recommended starting point is the systems that create the greatest tenant impact or represent single points of failure:
- Central chillers
- Main electrical distribution
- Key network aggregation points
- Access-control backends
- Elevator control logic, where possible
For these systems, begin with a simple metric set: availability, response time, and a small number of meaningful performance counters. Depending on the system, those may include flow, set-point deviation, and power draw.
Instrumentation is only useful when responsibility is clear. Centralized dashboards help, but teams must also assign ownership for alerts, escalation paths, and follow-up. Without a named person or small team responsible for reviewing and acting on alerts, notifications simply land nowhere.
Normalize Telemetry Before Choosing Tools
Commercial observability platforms can speed up correlation, but they can also introduce cost and vendor lock-in. Lightweight open tools, normalized metrics, Prometheus-style metrics, and simple time-series databases can be a practical alternative for teams with smaller budgets.
The episode emphasizes that the fundamental requirement is normalization, not a specific product. Define the metrics that matter in vendor contracts and project handoffs so vendors provide comparable data. Once telemetry is normalized, property teams can decide whether a consolidated dashboard or a federated approach best matches their staffing and budget.
Design Alerting to Preserve Trust
Alerting should be treated like a product: intentionally designed, reviewed, and improved. A practical three-tier model includes:
- Informational: Logs and trends that provide context but do not require immediate action.
- Warning: Sustained deviations that need attention.
- Critical: Conditions with immediate tenant impact.
Only critical alerts should generate after-hours page calls. Warnings can follow staged escalation, such as an email first and a text message if conditions continue. Critical conditions can warrant a phone call.
Every fired alert should be reviewed after an incident. If an alert is noisy, teams should adjust the threshold or choose a better signal. This ongoing review is how organizations reduce alert fatigue and rebuild staff confidence that an alert deserves attention.
Better Data Improves Vendors, Planning, and Governance
Normalized telemetry changes vendor conversations from feature lists to measurable outcomes. Rather than relying on a basic “device online” standard, teams can establish meaningful service-level expectations, such as sustained flow within five percent of set point.
Trend data also strengthens capital planning. It can reveal chronic inefficiencies before equipment fails, allowing teams to schedule targeted maintenance or upgrades based on actual performance. That supports longer asset life, more deliberate spending, and less reactive replacement.
Facilities should own alerts for tenant-impacting building systems, while IT should own network and cyber-related telemetry. A small joint governance board or monthly review can address the overlap between systems. The essential requirement is documentation: ownership, escalation paths, and clear actions when an alert fires. That preparation reduces finger-pointing during an incident.
Practical Wins From Simple Instrumentation
One low-cost tactic discussed in the episode is adding a simple flow sensor and small IoT gateway to a critical pump, then streaming the flow metric to a shared time-series endpoint. For a few hundred dollars, a previously opaque asset becomes more predictable.
Another example used the difference between supply and return temperatures across a main loop. A sustained overnight divergence alert led staff to investigate and find a fouled heat exchanger. They cleaned it during a planned window, avoiding a chiller replacement, tenant complaints during a summer heat spike, and significant expense.
A Three-Step Checklist for This Week
- Identify the top three tenant-impacting systems and define two metrics for each: availability plus one performance metric.
- Consolidate telemetry where possible. Even a shared spreadsheet or time-series endpoint is better than completely siloed portals.
- Assign alert ownership and schedule a 30-minute weekly review to tune thresholds and retire noisy alerts.
Instrumentation is an investment in predictability. Start small, standardize outputs, and treat alerts as a product. That approach helps teams move from firefighting toward prevention.
Building Observability Turns Signals Into Operational Insight
Buildings already produce a remarkable amount of operational data. Chillers report status. Pumps generate alarms. Access-control platforms retain activity. Elevators produce fault information. Network equipment records events. Vendors send notifications through portals, email, and proprietary dashboards.
Yet many property organizations still experience the same frustrating pattern: the data was available, but the problem was not understood until tenants felt it.
That gap is where building observability becomes valuable. Observability is not simply another dashboard initiative or a requirement to collect every possible data point. It is the practical ability to understand what a building system is doing from the signals it produces, recognize when performance is drifting, and act before a tenant-impacting event turns into a larger outage.
For commercial property teams, that has direct business value. Better visibility can protect tenant experience, reduce emergency vendor work, shorten troubleshooting, improve accountability, and support more informed capital planning.
Think Beyond Individual Alarms
A common operational failure starts with isolated alerts. A facilities vendor may send a low-priority notice about vibration. A building automation system may show alarms in its own interface. Another vendor portal may display related information. An elevator platform may show a separate condition. No single source looks urgent enough to trigger action, and no one sees the complete pattern.
By the time tenants report warm floors, slow elevators, or other disruptions, the issue has become more difficult to diagnose. Staff and vendors may spend valuable time debating which signal is trustworthy instead of addressing the underlying condition.
An observability mindset treats these signals as part of a system rather than disconnected events. It asks a more useful question: what is changing over time, and what does that change mean for system capacity, tenant impact, and operational risk?
Metrics, Logs, and Traces for Real Building Operations
Three categories make this approach easier to understand.
Metrics are numbers that teams track over time. In a building, that could include chilled-water flow, elevator door cycles, badge swipe rates, availability, response time, set-point deviation, or power draw. Metrics are especially useful when the risk is not an immediate failure but a decline that emerges over days, weeks, or months.
Logs are discrete events. Equipment alarms, vendor alerts, error messages, and system notifications all fall into this category. Logs provide context around what happened and when it happened, but they can become overwhelming if they are not prioritized and reviewed.
Traces are sequences that show how an issue ripples through connected systems. A power event, for example, can affect multiple services. Understanding that sequence is important when a team needs to determine whether separate symptoms share a common cause.
These categories are not academic labels. They help teams distinguish between a one-time event, a sustained degradation, and a system-wide chain of effects.
Why Slow Failures Are So Expensive
The most damaging operational problems are not always dramatic at the start. Consider a chilled-water loop where flow gradually declines because a variable-speed drive slowly loses calibration. The chillers may report healthy. The pumps may appear to be running. Individual vendor alarms may never reach a critical state.
But if no one tracks flow as a metric over time, the building loses capacity quietly. When outdoor temperatures increase, the system may no longer be able to keep up. What could have been planned maintenance becomes lost cooling across multiple floors, disrupted meetings, tenant complaints, emergency coordination, and a difficult search for root cause.
A sustained decline in a simple flow metric would have made the trend visible much earlier. That is the operational advantage of observability: it allows teams to see conditions that do not present as one obvious alarm.
Signal Chaos Is Both a Technical and Human Problem
Most property teams do not lack data. They lack a manageable way to use it.
Vendor silos are a major cause. Every provider may have its own portal, alerting rules, and telemetry format. The data can be useful inside each platform, but the property team is left with a dozen dashboards and no simple way to correlate the information.
Inconsistent telemetry standards compound the problem. A system may describe a condition differently from another vendor’s system. Intermittent telemetry, packet loss, clock drift, and threshold misconfiguration can create alerts at the wrong time or hide trends that actually matter.
Then there is the human consequence: alert fatigue. When alerts repeatedly prove to be low value or incorrect, staff stop trusting them. They may mute notifications or delay investigation. That erosion of trust makes it more likely that a meaningful warning will be ignored.
Solving this requires both technical normalization and operational governance. Teams need comparable signals, clear ownership, useful escalation rules, and a regular process for improving alert quality.
Start With Tenant Impact and Single Points of Failure
A small team with a limited budget should not try to instrument the entire property at once. Start where an outage would create the greatest tenant impact or expose a single point of failure.
- Central chillers
- Main electrical distribution
- Key network aggregation points
- Access-control backends
- Elevator control logic, where visibility is possible
For each selected system, use a small, repeatable metric set. Availability is essential. Add response time where it is meaningful. Then choose one or more performance counters that reveal whether the system is operating as expected, such as flow, set-point deviation, or power draw.
This approach keeps the initial effort focused. It also gives teams a baseline for deciding where additional instrumentation will have the greatest value.
Normalize the Data Before Debating the Platform
There is a natural question about tooling: should a property team purchase a commercial observability platform or use lightweight open tools and time-series storage?
Either approach can work. Commercial platforms may accelerate correlation and visualization, but they can add cost and sometimes create vendor lock-in. Open tools and normalized metrics can offer flexibility and support a more incremental rollout.
The more important decision is not the brand of platform. It is whether the organization has defined the signals it needs in a consistent way. Normalization means deciding what metrics matter and requiring vendors to provide comparable data through contracts and handoffs.
For example, a meaningful standard is stronger than a generic “device online” status. A property team may care whether a system maintains sustained flow within five percent of set point. That kind of measurable outcome creates a clearer basis for operational review and vendor accountability.
Once the data is normalized, teams can choose whether to consolidate it into one dashboard or retain a more federated approach. The right model depends on budget, staffing capacity, and the ability to maintain the process over time.
Make Alerting Useful Enough to Earn a Response
Alerting should be treated like a product. It needs intentional design, ongoing review, and refinement based on how people actually respond.
A practical model uses three tiers. Informational alerts provide logs and trends that add context but do not need immediate action. Warnings identify sustained deviations that need attention. Critical alerts represent immediate tenant impact and justify urgent escalation.
Only critical alerts should trigger after-hours page calls. Warnings can follow a staged process: an email first, then a text if the condition persists. Critical events can prompt a phone call.
Equally important, teams should review every alert that fired during a post-incident review. If an alert was noisy, the answer is not simply to accept the noise. Change the threshold, change the signal, or retire the alert if it does not support a useful decision. That feedback loop is how organizations restore trust in notifications.
Clear Ownership Prevents Incident Finger-Pointing
Dashboards and alert rules require owners. For tenant-impacting building systems, facilities should own the alerts. IT should own network and cyber-related telemetry. Where those responsibilities overlap, a small joint governance group can review issues monthly.
The size of the governance process matters less than its clarity. Teams need documented ownership, escalation paths, and instructions for what happens when an alert fires. That reduces the “not our problem” response that often appears when incidents involve multiple systems or vendors.
It also improves vendor relationships. With normalized telemetry, the conversation can move away from feature lists and vague status claims toward measurable performance expectations and meaningful service levels.
Low-Cost Instrumentation Can Deliver Meaningful Results
Observability does not always require a major capital project. One practical example is adding a simple flow sensor and a small IoT gateway to a critical pump, then sending the flow metric to a shared time-series endpoint. For a few hundred dollars, a previously opaque pump can become a more predictable asset.
Another example involved monitoring the delta between supply and return temperatures across a main loop. An alert for sustained overnight divergence identified a gradual separation. Staff investigated, found a fouled heat exchanger, and cleaned it during a scheduled window. The intervention avoided a chiller replacement, tenant complaints during a summer heat spike, and substantial reputational and financial cost.
The lesson is not that every system needs complex monitoring. It is that the right metric, reviewed at the right cadence, can prevent a costly failure.
A Practical First Week
Property teams can begin building observability momentum immediately:
- Identify the three systems most likely to affect tenants and define availability plus one performance metric for each.
- Consolidate telemetry where possible. A shared spreadsheet or time-series endpoint is still an improvement over completely isolated portals.
- Assign alert ownership and hold a 30-minute weekly review to tune thresholds and remove noisy notifications.
Instrumentation is an investment in predictability. Start small, standardize outputs, and continuously improve alerting. The result is a building operation that spends less time firefighting and more time preventing avoidable disruption.
Listen to this episode of Built, Wired & Secured for a practical discussion of how property teams can turn building signals into operational insight without overbuilding the program from day one.