
Show Notes
Episode overview
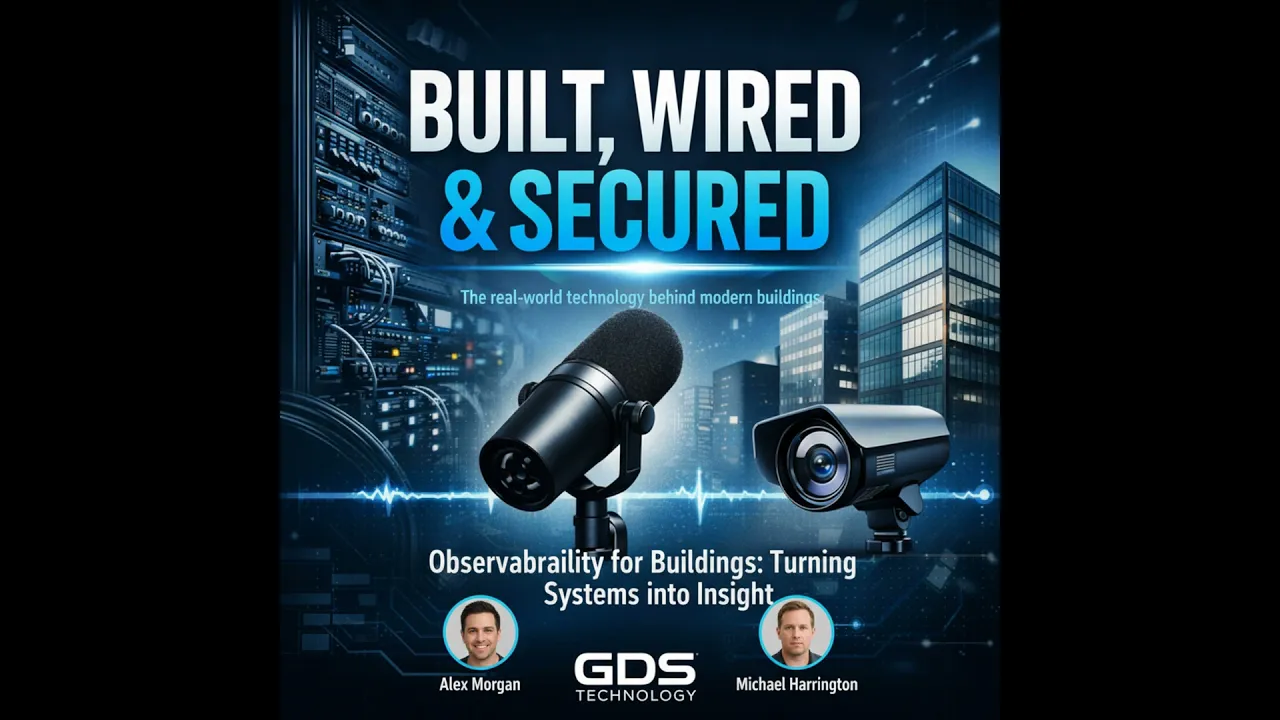
Modern buildings are full of signals, but most teams still treat those signals as isolated events. In this episode of Built, Wired & Secured, Alex Wagan and Michael Harrington explain what an observability mindset looks like in real building operations and why it matters before a small issue turns into a tenant-facing outage.
The conversation starts with a realistic scenario: tenants complain about warm floors and slow elevators, vendors send low-priority alerts, BAS alarms spike across different portals, and nobody has a single place to see what is happening. By the time a chiller trips, the damage is already visible to tenants and the response team is wasting time arguing over which signal to trust. That is the gap observability is meant to close.
What observability means in a building context
The episode translates core observability ideas into building operations:
- Metrics are numbers tracked over time, such as chilled water flow, elevator door cycles, badge swipe rates, power draw, and set point deviation.
- Logs are discrete events, including alarms, vendor alerts, and error messages.
- Traces are sequences that show how one issue ripples through multiple systems, such as a power problem affecting downstream equipment.
The point is not to collect every possible data point. It is to choose the right signals, normalize them, and make them useful for operational decisions.
Why projects break down
Michael points to signal chaos as the most common failure pattern. Buildings often have dozens of vendors, each with its own dashboard, telemetry model, and alert logic. Staff end up juggling siloed systems instead of seeing a coherent operating picture.
The episode also highlights several reasons observability efforts fail:
- Vendor silos and proprietary dashboards
- Inconsistent telemetry standards
- Alerts that are technically active but operationally meaningless
- Loss of staff trust after repeated false alarms
- Intermittent telemetry issues such as packet loss and clock drift
- Thresholds set so poorly that they hide the slow trends that actually matter
That mix of technical and organizational problems is what allows gradual degradation to stay invisible until it becomes expensive.
The danger of slow failures
One of the strongest examples in the episode is a chilled water loop where flow rates declined gradually over months because a variable speed drive lost calibration. No individual alert looked critical. Pumps showed as running and chillers appeared healthy. But no one was watching the trend line over time. When outdoor temperatures rose, system capacity dropped and multiple floors lost cooling.
The lesson is straightforward: the absence of a dramatic alarm does not mean the system is healthy. A simple metric with a sustained-decline alert could have exposed the issue early.
Where to start without overspending
For teams with limited budget and staff, the advice is practical. Start with systems that are either single points of failure or most likely to affect tenants directly. That includes:
- Central chillers
- Main electrical distribution
- Key network aggregation points
- Access control backends
- Elevator control logic where possible
Then define a small metric set for each one: availability, response time where relevant, and a few meaningful performance counters.
The tooling decision matters less than normalization. Commercial platforms may speed up correlation but add cost and lock-in risk. Open tools and simple time-series approaches can work well if vendors are required to deliver comparable data in contracts and handoffs.
How to reduce alert fatigue
The episode treats alerting as something that should be designed and maintained, not just switched on. Michael recommends a simple three-tier structure:
- Informational for logs and trends
- Warning for sustained deviations that need attention
- Critical for immediate tenant impact
Only critical alerts should trigger after-hours paging. Warnings should escalate in stages, such as email first and text next. The team should also review every alert after an incident and either tune the threshold or change the signal if the alert proved noisy. That review cycle is how teams rebuild confidence in the system.
Operational and financial impact
Better observability changes more than troubleshooting. It also improves vendor accountability and capital planning. Once telemetry is normalized, teams can hold vendors to meaningful service levels tied to performance, not just device status. Trend data also helps identify chronic inefficiencies early enough to schedule maintenance or targeted upgrades instead of reacting to failures under pressure.
Practical examples and this week’s checklist
The episode closes with two grounded examples: a low-cost flow sensor and IoT gateway that made a critical pump visible, and a temperature-delta alert that helped a campus team find a fouled heat exchanger before it caused major disruption.
If you want to act on this now, the episode offers a clear weekly checklist:
- Identify the top three tenant-impacting systems
- Define two metrics for each, including availability and one performance metric
- Consolidate telemetry somewhere shared, even if it starts as a spreadsheet or simple endpoint
- Assign alert ownership
- Schedule a short weekly review to tune thresholds and retire noisy alerts
The message throughout the episode is consistent: start small, standardize outputs, and treat alerts like a product. Done well, observability helps building teams move from reactive firefighting to predictable operations.
Buildings do not have a visibility problem. They have an interpretation problem.
Most commercial buildings already generate more signals than their teams can comfortably manage. BAS alarms fire. Access control platforms log events. Vendor portals send notices. Mechanical systems expose readings. Network infrastructure records status and faults. Yet many property teams still find themselves learning about real issues from tenant complaints instead of from the systems they already pay to operate.
That tension sits at the center of this episode of Built, Wired & Secured. The discussion frames modern buildings as observable systems and argues that the goal is not to collect every possible data point. The goal is to turn the right signals into decisions before service quality slips.
What observability looks like outside software
The episode makes a useful translation. In software, observability usually revolves around metrics, logs, and traces. In buildings, those concepts still apply, but the examples are more operational.
Metrics are the numbers that matter over time: chilled water flow, power draw, elevator door cycles, badge swipe rates, set point deviation, supply and return temperature deltas. Logs are the discrete events: alarms, vendor notices, error messages, system status changes. Traces are the sequences that show how one issue affects another system, such as a power event that ripples into mechanical performance, access control disruptions, or network instability.
That framing matters because it pushes teams to think in terms of patterns instead of isolated alerts. A single alarm may tell you something happened. A trend tells you whether the system has been degrading quietly for weeks.
Why teams miss the problem until tenants feel it
The opening scenario in the episode is familiar for anyone responsible for real property operations. Tenants start noticing warm floors and slow elevators. A facilities vendor has already been sending low-priority emails about pump vibration. BAS alarms are rising across separate portals. There is no unified view, and by the time the chiller trips, the building has already crossed from warning signs into outage.
That is the operational cost of fragmented visibility. No one signal looked decisive enough on its own, so no one acted with confidence. Once the failure becomes visible to tenants, the team loses time debating which alarm source is trustworthy. At that point, the problem is no longer just technical. It is reputational and operational.
Signal chaos is usually self-inflicted
The episode identifies signal chaos as the main reason observability efforts fail in buildings. The issue is rarely a complete lack of telemetry. It is that the telemetry is fragmented, inconsistent, and poorly governed.
Vendors often expose useful data, but they do it in proprietary formats or isolated dashboards. One contractor may report healthy operation because its device is online. Another may issue warnings based on a threshold that was never tuned for the building. Staff absorb repeated false alarms, stop trusting the notifications, and eventually ignore the few that matter.
That organizational drift is just as dangerous as a hardware failure. Once trust in alerting erodes, the building still produces signals, but the team stops treating them as decision-grade information.
The transcript also points to quieter technical causes: packet loss, clock drift, and misconfigured thresholds. None of those issues makes for a dramatic outage story on its own, but together they distort the operating picture enough to hide slow failure modes.
The most expensive failures are often gradual
One example in the episode captures the value of observability better than any abstract definition. A chilled water loop experienced a slow flow-rate decline over months because a variable speed drive was drifting out of calibration. Pumps appeared to be running. Chillers looked healthy. No single vendor alarm rose to the level of urgency.
But the system was getting weaker. When outdoor temperatures rose, the building no longer had the cooling capacity it seemed to have on paper, and multiple floors lost service.
This is the core lesson for property teams: many building failures do not arrive as a dramatic red light. They arrive as a trend nobody owned. Observability gives teams a way to catch sustained decline before seasonal load or tenant demand exposes it.
Start where failure hurts most
The practical guidance in the episode is intentionally modest. Do not try to instrument everything at once. Start with the systems that are either single points of failure or most likely to affect tenants directly.
That includes central chillers, main electrical distribution, key network aggregation points, access control backends, and elevator control logic where possible. For each of those systems, define a small, stable metric set. Availability is a baseline. Add a performance signal that actually reflects health, such as flow, power draw, response time, or deviation from set point.
This is important because many teams fall into a false choice between doing nothing and doing a full platform overhaul. The episode argues for a narrower path: pick a few assets that matter, make their data comparable, and assign someone to care about the outputs.
Tool selection matters less than normalization
The discussion does not push a product. Instead, it focuses on the conditions that make any tool stack useful.
Commercial observability platforms can help correlate signals faster, but they come with cost and potential lock-in. Lightweight open tools or simple time-series databases can be enough for many portfolios if the incoming telemetry is normalized. That means defining the metrics that matter and requiring vendors to deliver them in comparable ways through contracts, handoffs, or integration standards.
In other words, the platform cannot fix a governance problem. If each vendor reports data differently and no one has agreed on the operating definitions, the dashboard will simply centralize confusion.
Alert fatigue is not a side issue
One of the most useful parts of the episode is the treatment of alerting as something that needs product thinking. Teams should not accept every alert a system can generate just because it is available.
The recommended structure is simple: informational alerts for trends and logs, warnings for sustained deviations, and critical alerts for immediate tenant impact. Only critical conditions should trigger after-hours paging. Warnings should move through staged escalation, such as email first, then text. Most importantly, every alert that fires should be reviewed afterward. If it was noisy, fix the threshold or change the signal.
That process matters because alerting only works when people believe it is worth interrupting their day. Trust is not built by adding more notifications. It is built by making the existing ones credible.
Better visibility changes business decisions too
The benefits described in the episode go beyond troubleshooting. Better observability improves how owners and operators manage vendors, budgets, and asset life.
When telemetry is normalized, service conversations become more concrete. Instead of arguing about whether a device was technically online, teams can measure whether a system stayed within acceptable performance bounds. That changes how service levels are written and enforced.
The capital planning impact is just as important. Trend data reveals chronic inefficiencies earlier, which allows targeted maintenance and scheduled repairs before a failure forces emergency replacement. That is a better outcome for tenant experience, operating budgets, and long-term planning.
A realistic first move for property teams
The closing checklist is refreshingly practical. Identify the top three tenant-impacting systems. Define two metrics for each, including availability and one performance metric. Consolidate telemetry somewhere shared, even if that means starting with a spreadsheet or a simple time-series endpoint. Assign alert ownership. Then hold a short weekly review to tune thresholds and retire noisy alerts.
That sequence works because it creates discipline before scale. A building team does not need perfect observability to improve outcomes. It needs a smaller number of signals that people trust and act on.
That is the broader message of the episode. Instrumentation is not just about collecting data. It is an investment in predictability. Teams that start small, standardize outputs, and manage alerting deliberately put themselves in a much better position to prevent downtime instead of explaining it afterward.
If this episode reflects challenges you see across your properties, it is worth a listen. It offers a grounded way to think about observability in buildings without turning the conversation into a tool debate.